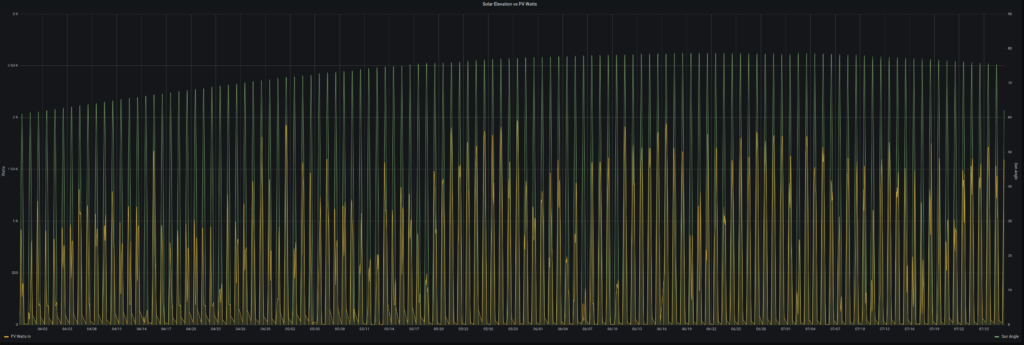
I think this graph is neat, because it shows a long history of solar angle as the year marches on.
As you can tell, we’re not driving a lot right now, though.
If we were moving in latitude, you’d see the solar angle deviate from the seasonal curve. If we were moving in longitude, you’d be able to see the solar angle curve phase shift left or right relative to the other days, due to the difference in time.
Those phase shifts aren’t visible in the graph, but I’ve seen them before when driving a lot.

Maybe it’s time to take some trips…for science!